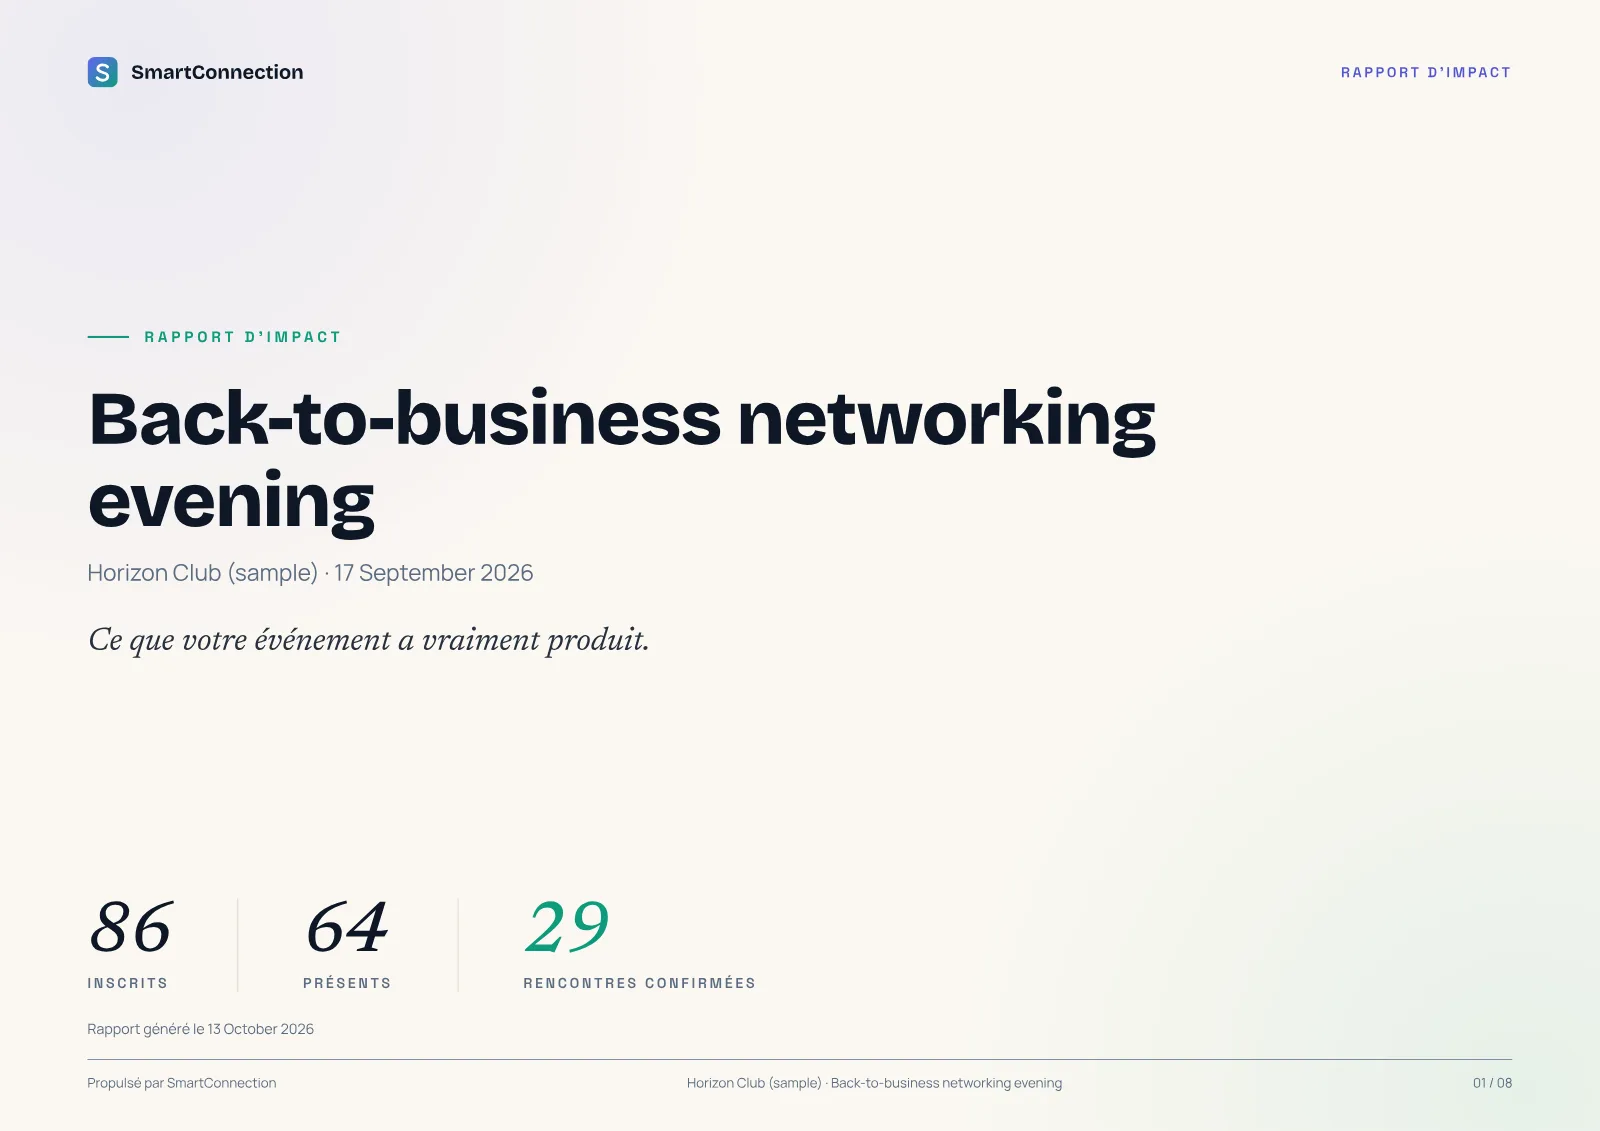
Page 01 · Cover
Three figures, read in five seconds
- Registered, present, confirmed meetings: what your board asks for first.
- Your organisation's logo on the cover.
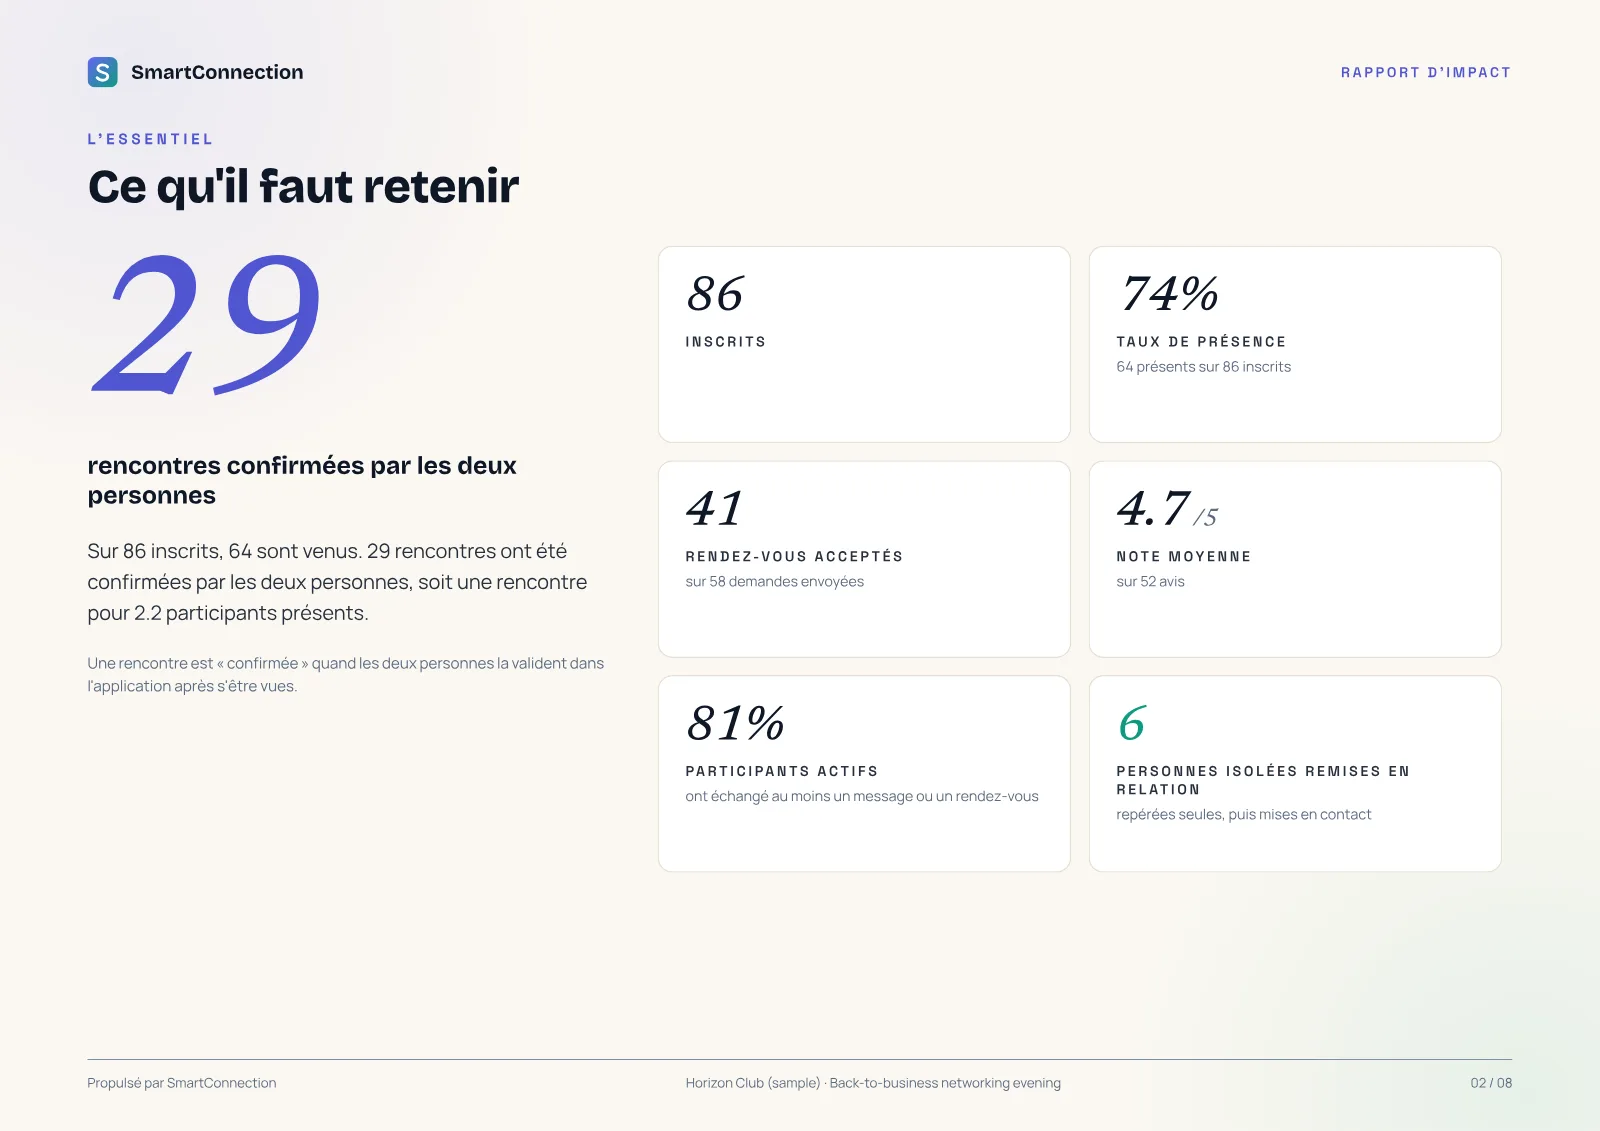
Page 02 · Key points
A sentence that explains the figures
- The report spells out what the figures mean: nobody has to interpret them.
- Attendance rate and accepted meetings, side by side.
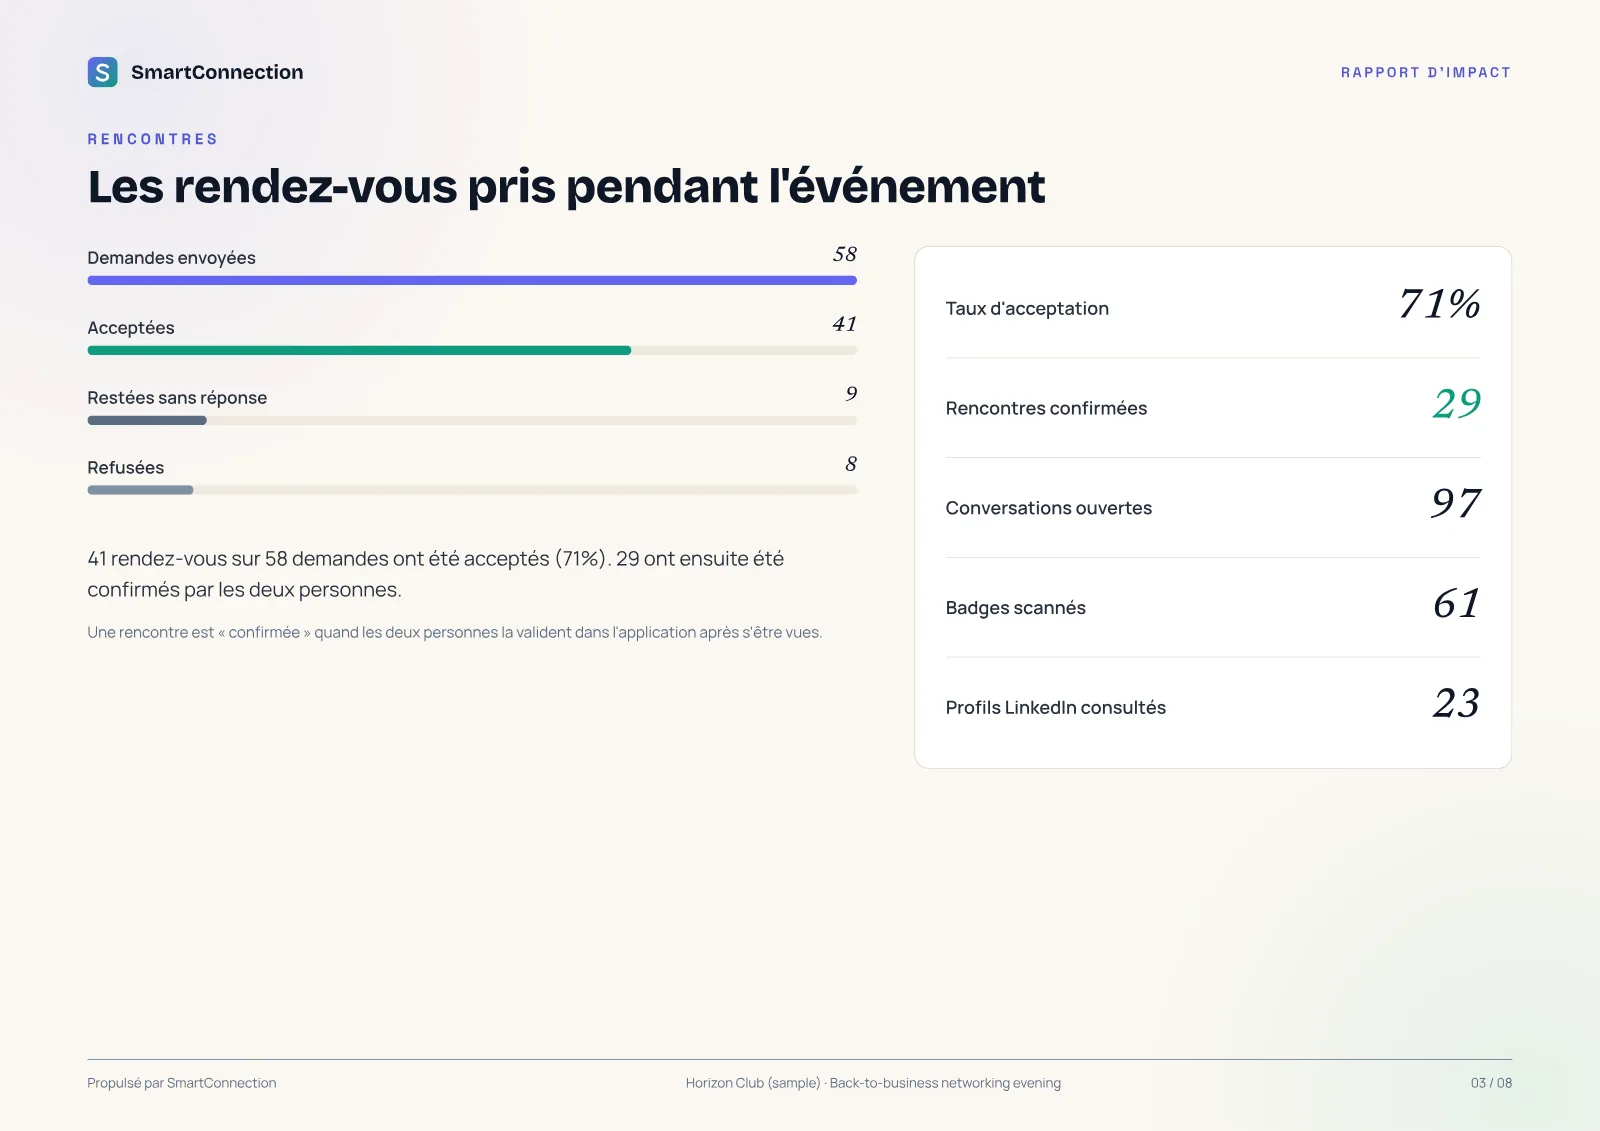
Page 03 · Meetings
Meetings confirmed by both people
- A meeting only counts when both people confirm it after meeting.
- From request to meeting: you see where things stall.
- Conversations, scanned badges, profiles viewed.
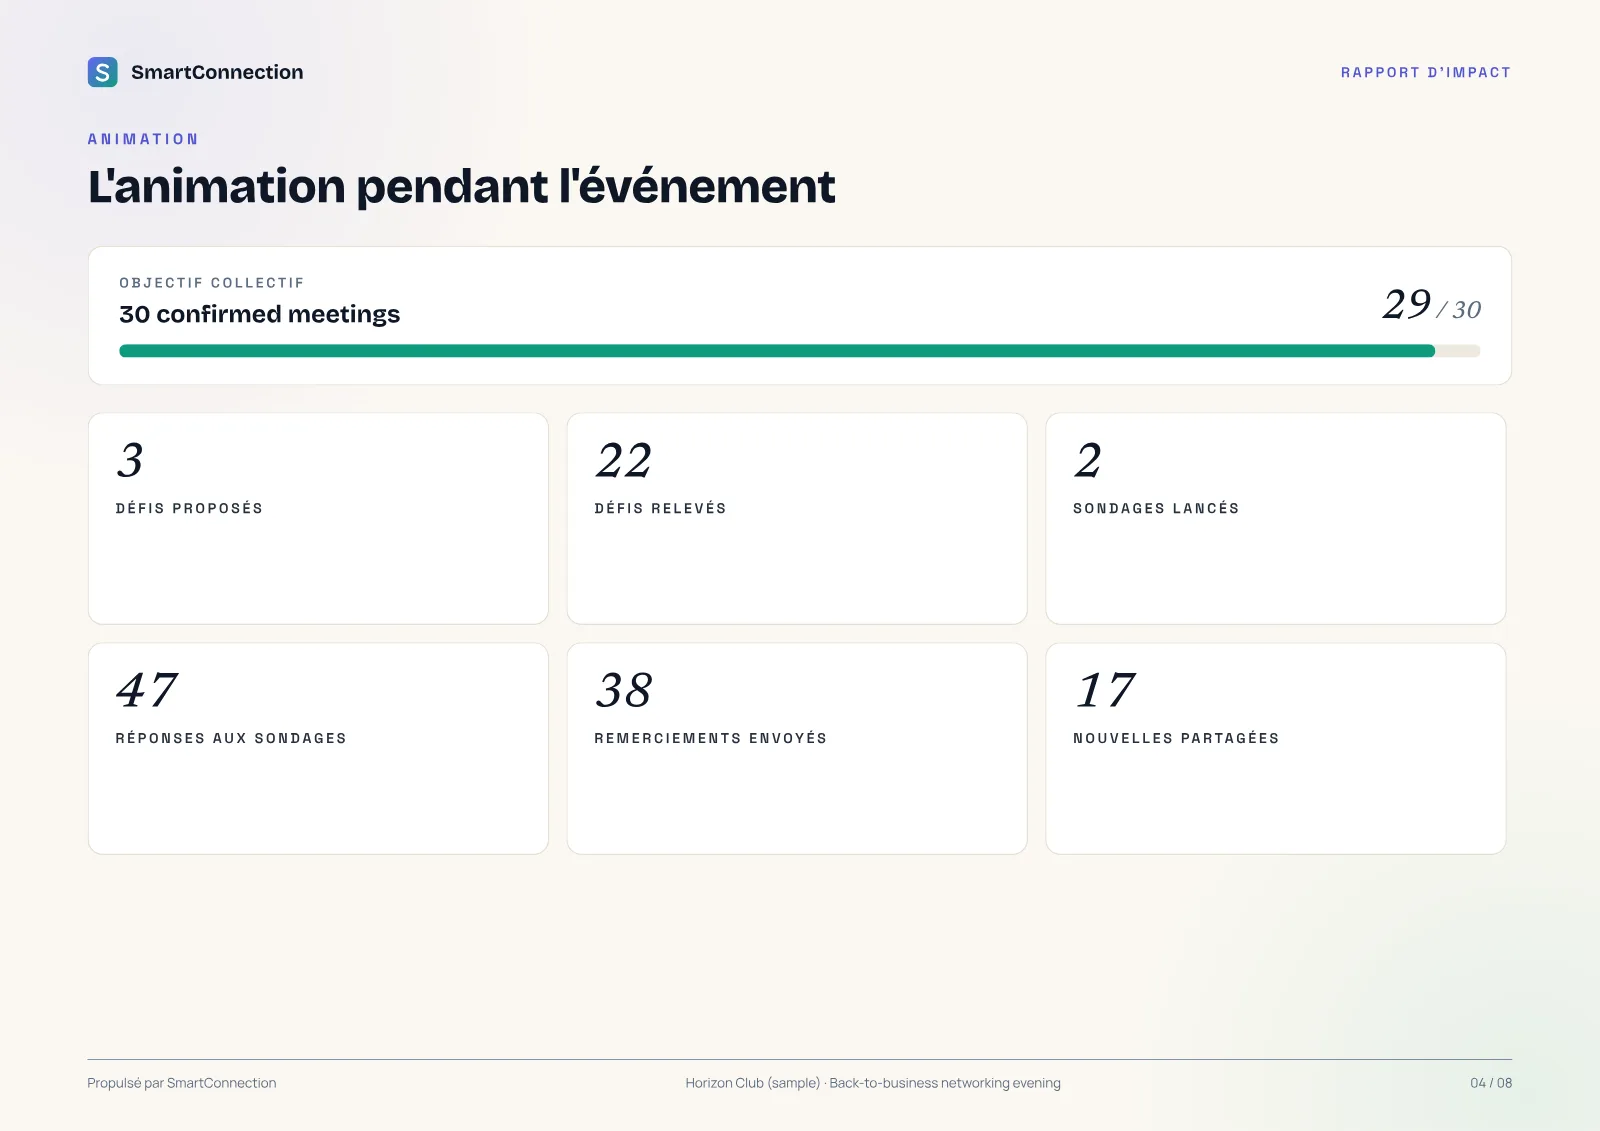
Page 04 · Engagement
What the room did
- Group goal, challenges, polls, thank-yous between attendees.
- Didn't run any? The page disappears on its own.
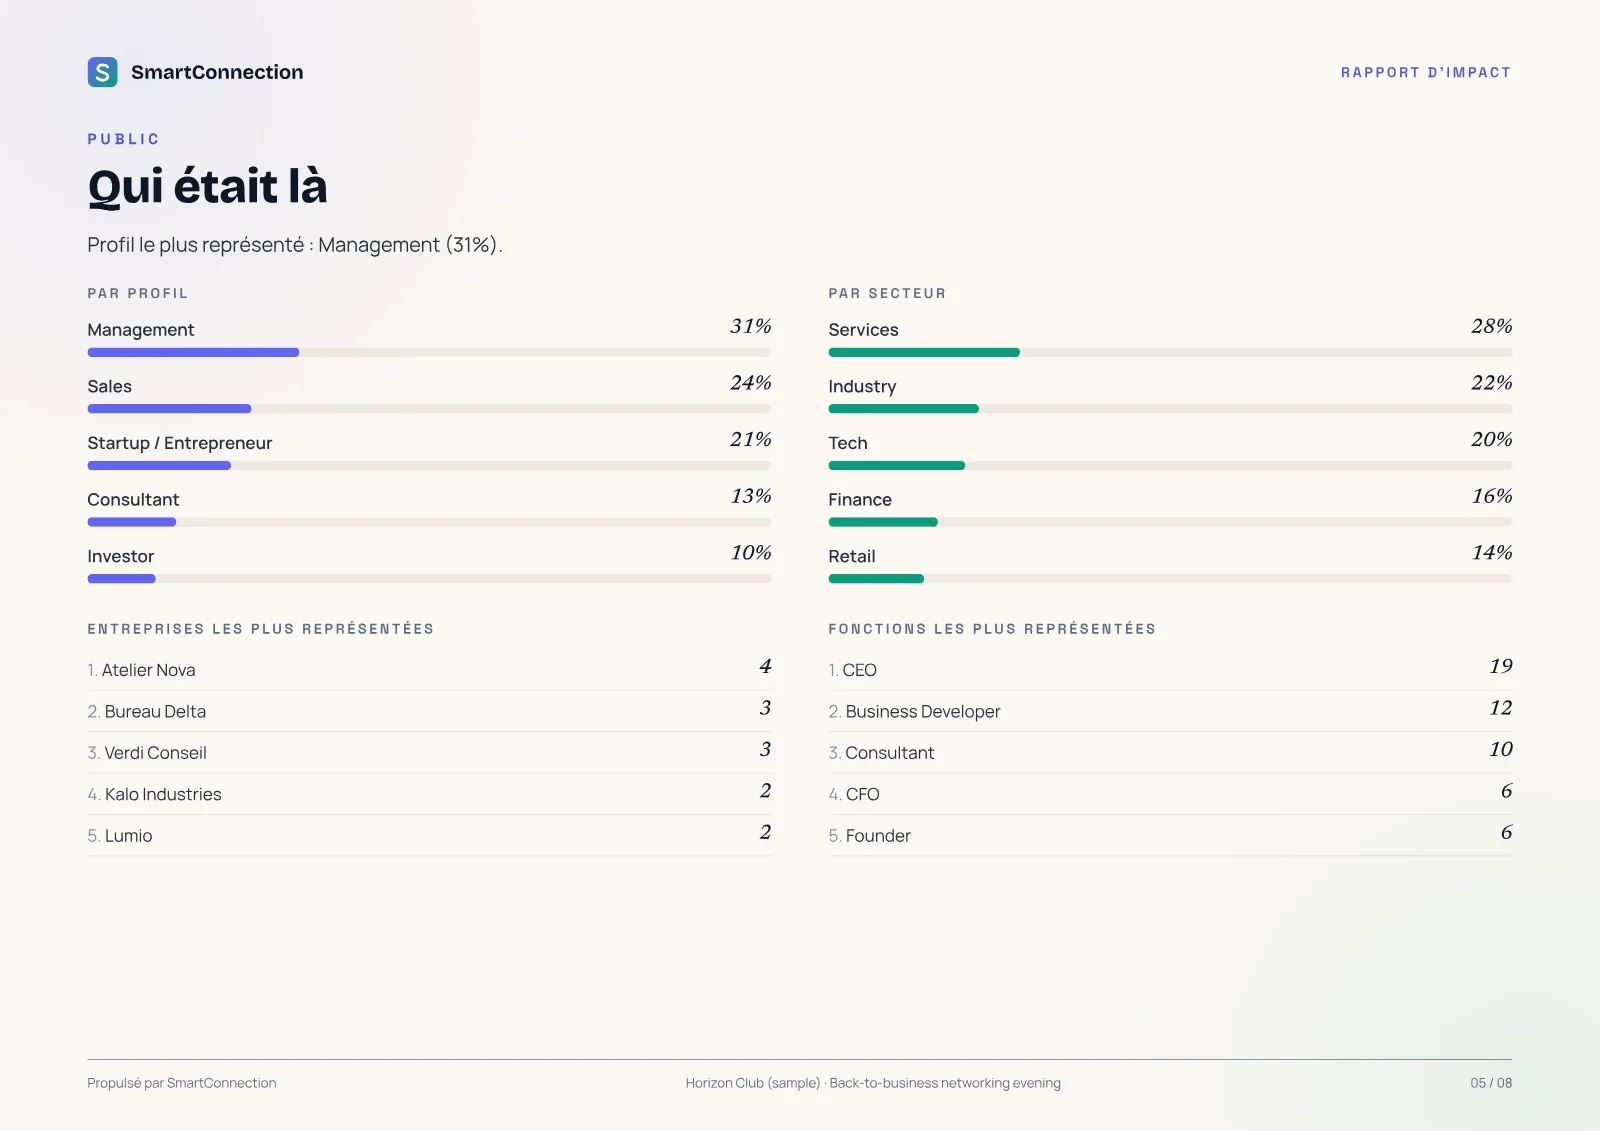
Page 05 · Audience
Who was there
- The most represented profiles, sectors, companies and roles.
- The page to show your sponsors.
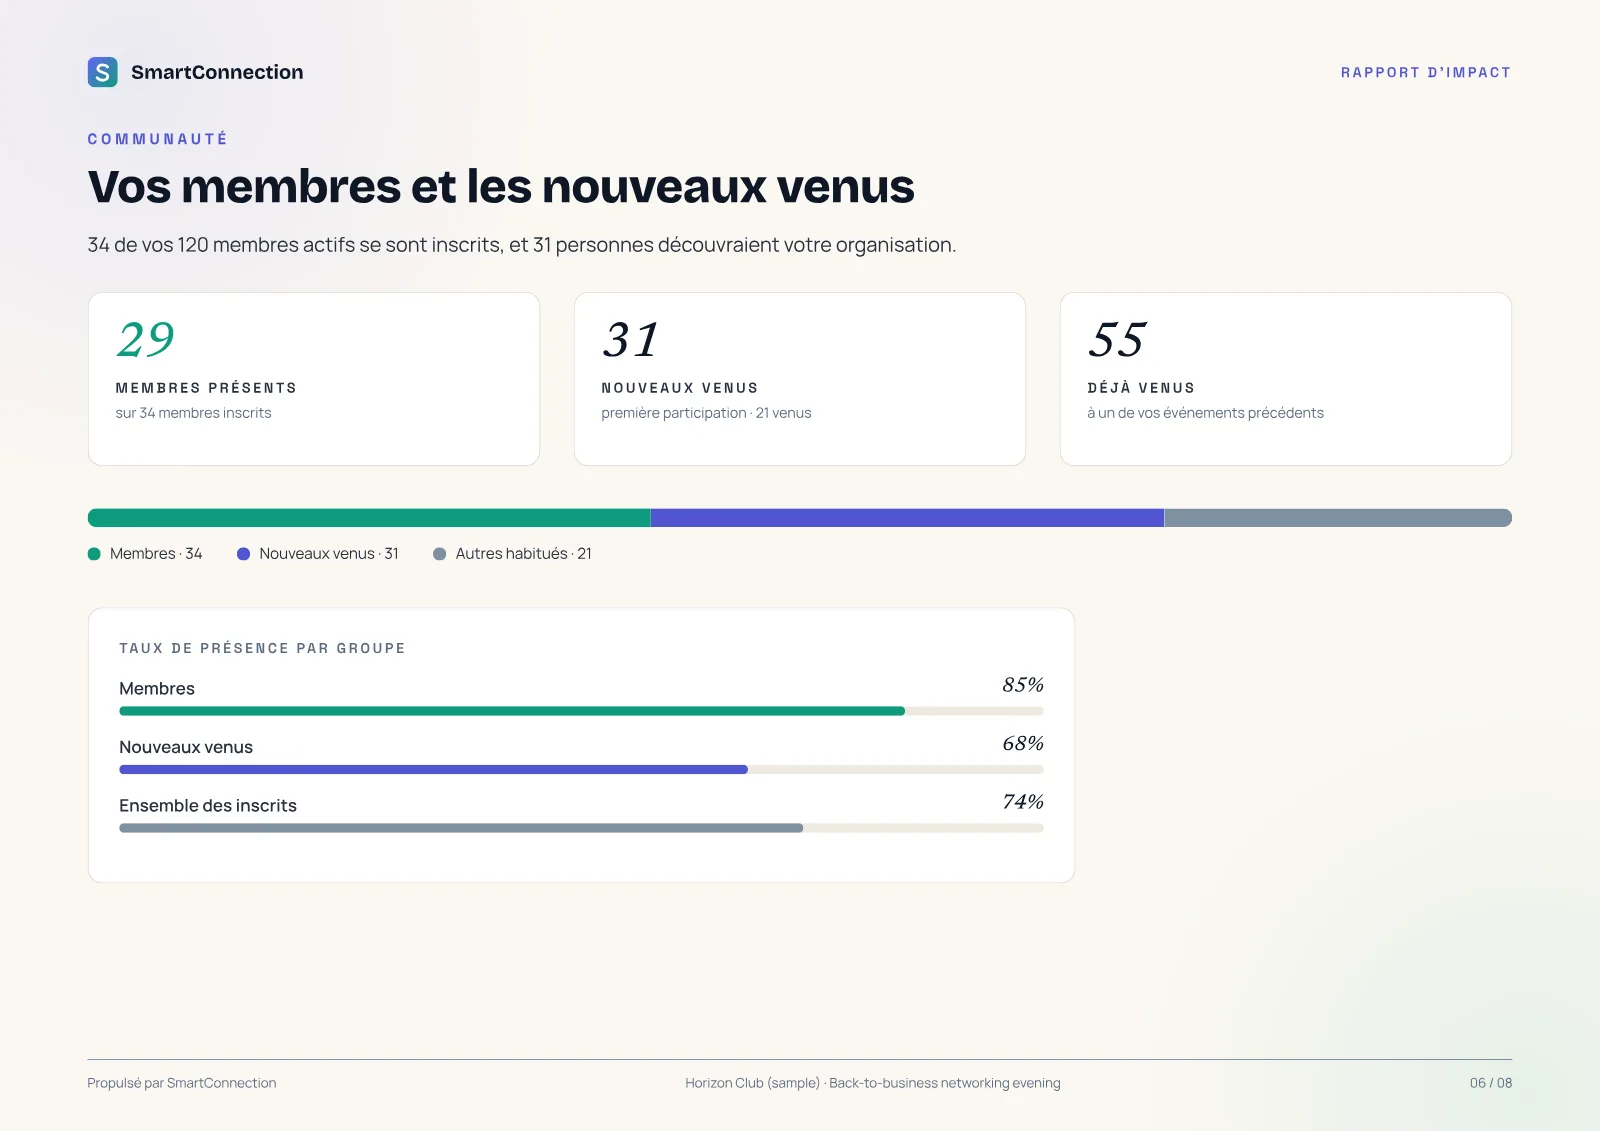
Page 06 · Community
Your members and the newcomers
- How many of your members came, and who was discovering your organisation.
- The attendance rate of each group.
- Appears when you keep your member list in SmartConnection.
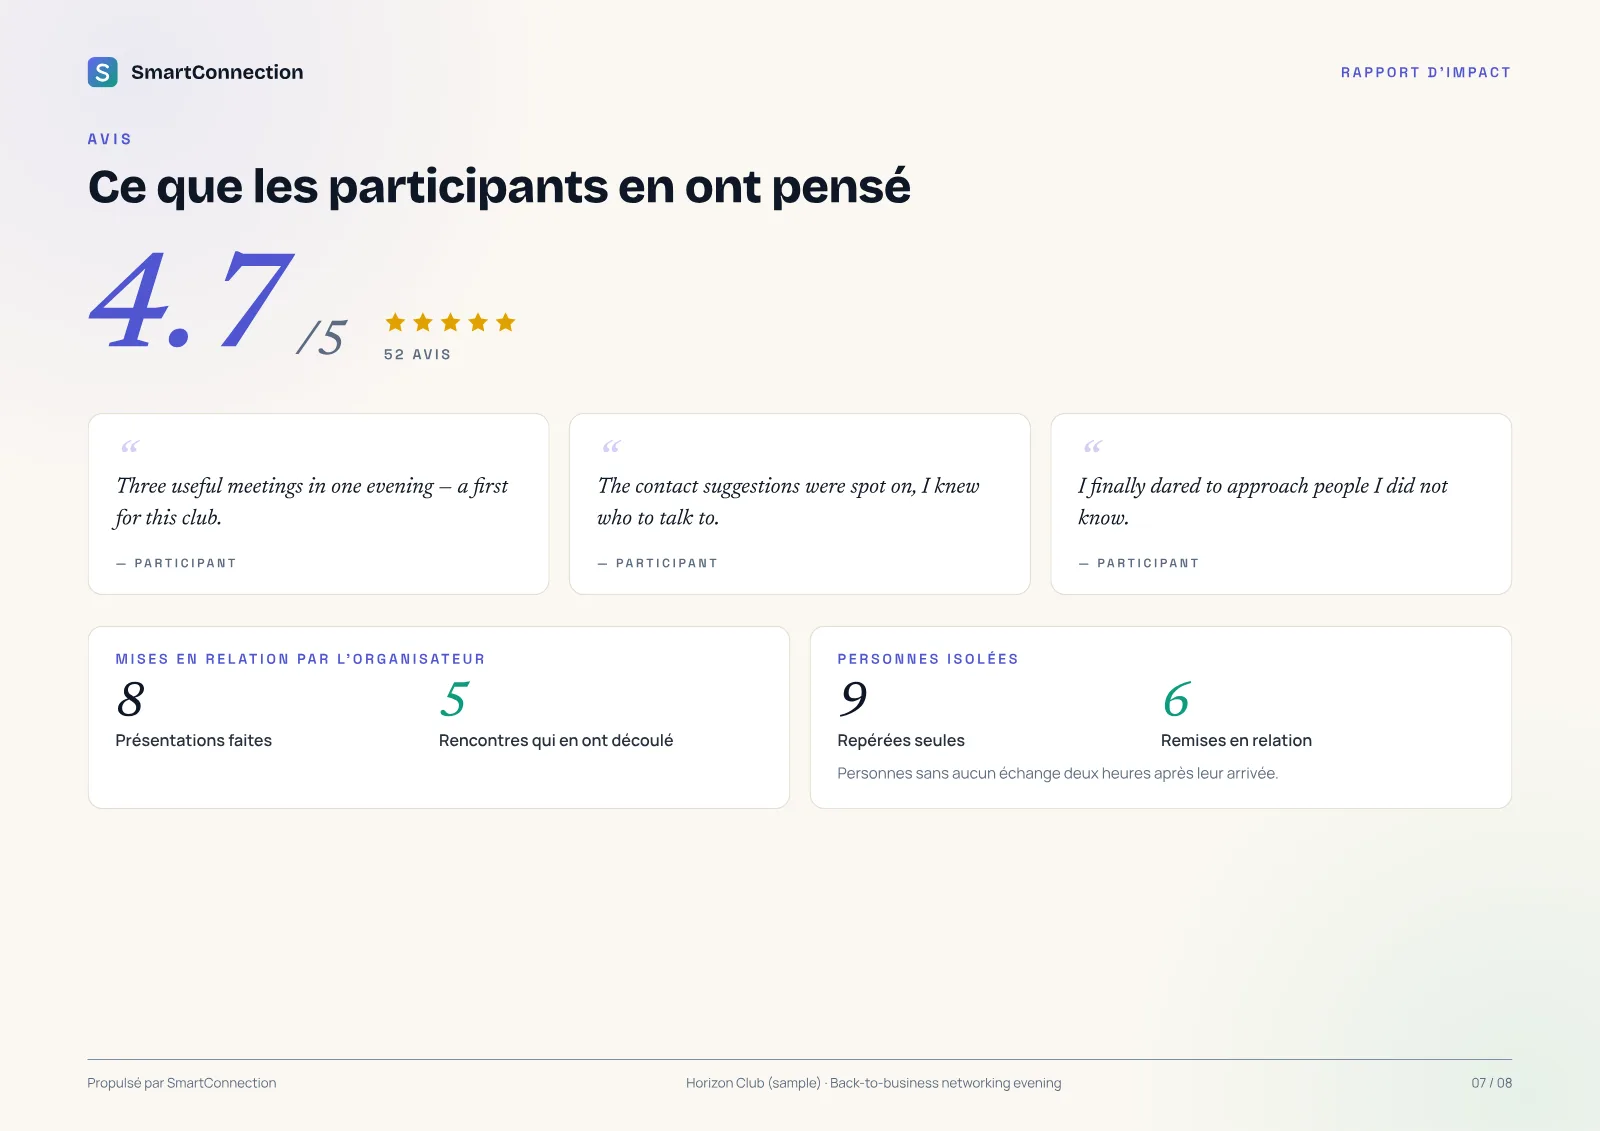
Page 07 · Feedback
What attendees thought
- The average rating and quotes from the feedback.
- The introductions you made, and the meetings that came out of them.
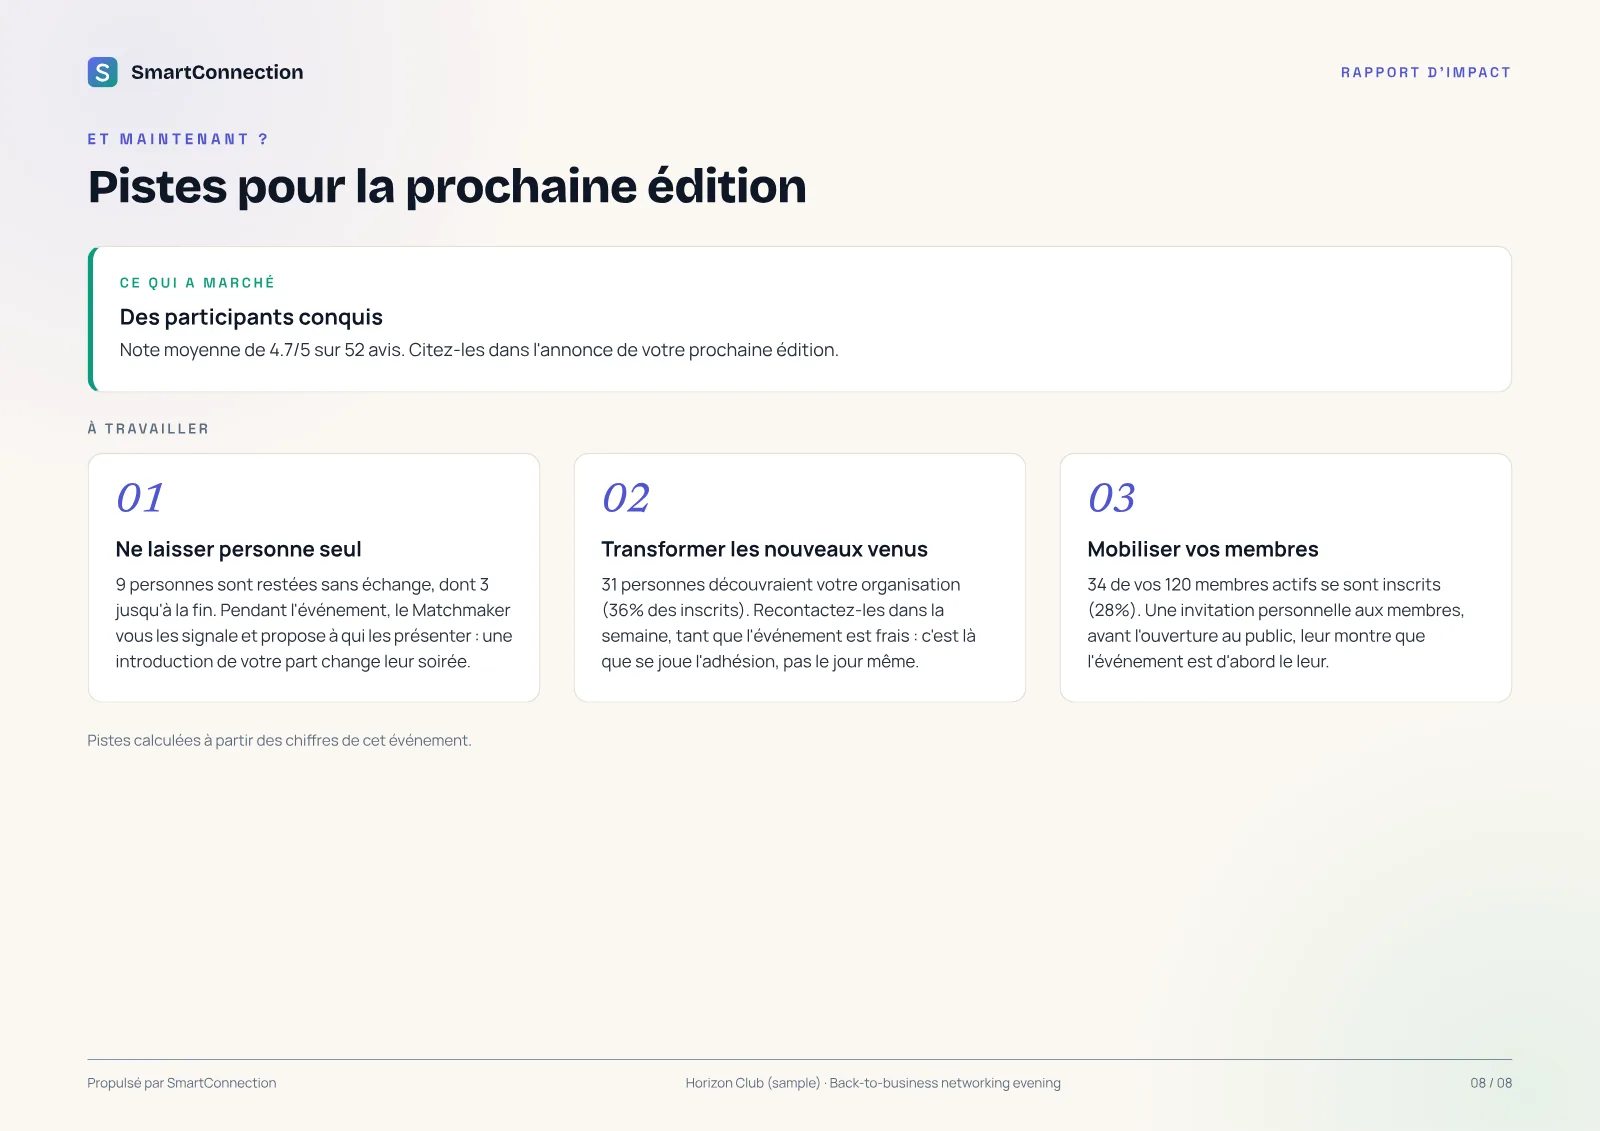
Page 08 · What next?
Ideas for the next edition
- Worked out from your figures: the text changes from one event to the next.
- Always a strength alongside the points to work on.